
All features
Insights
The night, in numbers that add up.
Revenue, busy hours and dishes sit beside the orders they came from. What you export is what you saw on the screen.

AnalyticsRevenue
Top-selling dishes7 days
- 1House Smash84×
- 2Brisket Loaded Fries61×
- 3Bitterballen58×
From every order to the whole picture.
What the day did
Compare daily revenue and orders for one location or all locations together. Choose the reporting period.

AnalyticsTop-selling dishes
- 1House LagerOn tap112×
- 2House SmashBurgers84×
- 3Brisket Loaded FriesSides61×
- 4BitterballenBar snacks58×
- 5Crispy HalloumiVegetarian47×
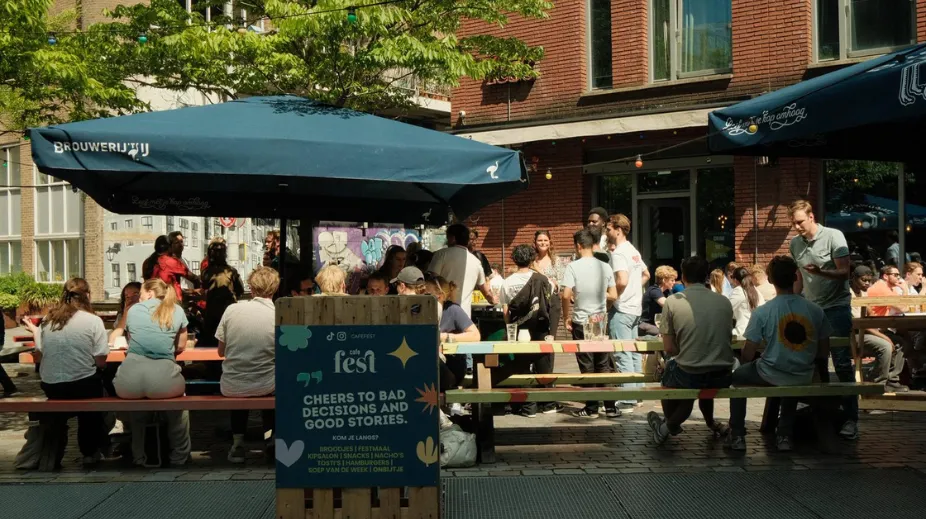

In hospitality you always have peaks and quiet spells. Orderli’s data gives us good insight. That’s useful to fall back on when we need it.
 Hannah Brühl · Café FestCo-owner, De Bartel Groep
Entree Magazine · 22 December 2025Translated from DutchRead the article
Common questions
Can I view performance by menu item?
Yes. Menu-item analysis connects available ordering data to the selected product.
Can I recognise returning guests?
Retention insight is available where guest data can be used with the right consent and recognition.
Does this replace accounting?
No. These insights support operational and menu choices; financial accountability belongs in reporting and your accounts.